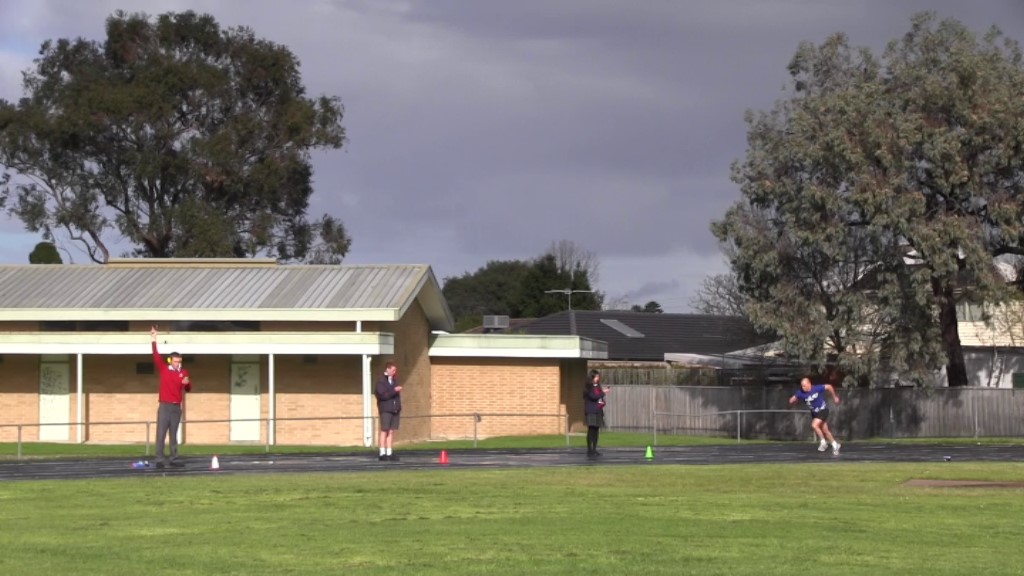
In these activities, students investigate how a range of different objects (including themselves) move.
 Analyzing Usain Bolt’s 100-metre Sprint
Graphing and Analysing Usain Bolt’s 2008 World Record 100m Sprint (pdf)
This activity asks students to analyze (or analyse) Usain Bolt’s 2008 world-record 100m sprint.
Graphing Usain Bolt 2008 WR 100m Sprint (Excel Document)
(Photo by Phil McElhinney)
Analyzing Your Own 100-metre Sprint

 This activity blends Physics and Physical Education. Ten-metre-interval split times are recorded for a sprinter running a 100-metre race and, from the data, an analysis is made of the sprinter’s performance. Choose the prac that suits you best:
 Graphing Motion: the 100m Sprint: In this prac, students analyse their own 100m sprints using Displacement vs Time graphs AND Velocity vs Time graphs.
 You vs Usain Bolt in a 100m Sprint: This prac looks only at Displacement vs Time graphs and asks students to compare their sprint performances with Usain Bolt’s (when he ran his 2008 then-world-record sprint).
Graphing Motion: the 100m Sprint (Displacement vs Time only): This prac is the same as the previous prac but no reference is made to Usain Bolt.
For extra detail!
Graphing Motion Practical Activity: Analysing a 100m Sprint (at 5-metre Intervals) (pdf)
Drawing Graphs on a Google Sheet Spreadsheet.
Practice Graph (Google Sheet) (same as the one in the video)
Graphing Usain Bolt’s 2008 WR 100-metre Sprint (Google Sheet)
Graphing Usain Bolt’s 2008 (then) WR 100m Sprint Data (Google Doc)
In class, I show my students the video and then give them access to the Practice Graph Google Sheet. Once they do that, I give them access to the Usain Bolt Google Sheet. They complete the tables and draw up a distance vs time graph and a velocity vs time graph. I then ask them to copy and paste the two graphs into the Usain Bolt Google Doc and to answer the questions in that doc.

See the following Shedding Light on Motion pages for more content.
Shedding Light on Motion Episode 4: Graphing Motion
Shedding Light on Motion Episode 5: Graphing Free Fall
Also, see our Usain Bolt vs Spiro Liacos page for more information about the Physics of Usain Bolt’s sprint.
 How Fast Do You Walk? The Walking and Jogging Speed practical activity is a simple practical activity that involves getting the students to calculate how fast they walk and how fast they jog.
All you’ll need is a tape measure (or a trundle wheel) and a stop watch.
Walking and Jogging Speed Practical Activity

How Fast Can You Kick a Ball?
This activity also blends Physics and PE. A ball is kicked (or thrown) 10 metres. The action is recorded and the video file is analysed using Quicktime, VLC, or Windows Media Player. (See Usain Bolt vs Spiro Liacos for more details.)
Calculating Throwing and Kicking Speed
At What Rate Does a Falling Golf Ball Accelerate?


 This activity also requires the use of Quicktime or other software that allows frame-by-frame forwarding. A ball is dropped, the motion is recorded and the video file is analysed. Don’t forget to include a metre-ruler in the shot!
Most cameras that take videos record at 30 frames per second, but in Australia, the UK and many other places actual video cameras record at 25 frames per second. You therefore need to select the activity sheet that suits your camera. Mobiles record at 30fps.
Vertical Motion: Analysing the Motion of a Falling Golf Ball (30 frames per second)
Teachers, send me an email and I will provide you an example of the data and graphs that a student generated a few years ago. (The email address must be a school email address, not a gmail or similar.) Send Email
Vertical Motion: Analysing the Motion of a Falling Golf Ball (25 frames per second)
Projectile Motion: Oblique Projection (30 frames per second) This activity is similar to the Vertical Motion activity above but is more advanced.
 Ticker Timers: An Introduction
This activity, as the name suggests, introduces students to ticker timers.
Ticker Timers: An Introduction
 How Quickly Does a Falling 1kg Mass Accelerate?
In this activity, students calculate the acceleration of a falling object.
Acceleration Due To Gravity: Ticker Timers
 The Space Shuttle
This worksheet explains how to use Excel to process data and to draw graphs. Students draw a velocity vs time graph for the Space Shuttle’s 8-minute ascent into space.
Space Shuttle Speed vs Time graph of Launch to MECO (student example) (pdf)
Space Shuttle Launch Timeline And Graph Worksheet (pdf)
Space Shuttle Launch Timeline And Graph Raw Data (This is an MS Excel document with the Space Shuttle’s ascent data already typed in.)
You can, of course, just use the data to draw a graph on paper as well!!
GET IN TOUCH WITH US.
By Email: learning@liacoseducationalmedia.com
By Phone: +61 (0)3 9543 5446; +61 (0)433 061 117
Via our Contact Form below:


